
Package room metrics that predict complaints (not just volume)
Most buildings can tell you how many packages came in yesterday. That number rarely tells you why residents are about to complain. Complaints come from friction: a carrier drop that sits too long, a label that cannot be matched to a unit, a package that gets moved twice and disappears into overflow, or a pickup line that forms at the worst possible time.
The most useful package room metrics are leading indicators: signals that a delay, mis-notification, or dispute is forming before the front desk gets flooded. Instead of reporting vanity counts, this article focuses on 6–8 actionable mailroom KPIs that map directly to resident experience: average dwell time packages by carrier, the “unknown unit” rate, second-touch rate, mis-sort rate, re-scan rate, package retrieval time during peak, and a simple peak hour staffing signal.
The goal is practical: pick a small set of package room metrics your team can measure consistently in 15 minutes a day, then tie each metric to a specific policy or workflow lever (intake steps, shelf zoning, QR-label discipline, exception tagging, staffing shifts, and pickup flow). When the numbers move, you will know exactly what to change—before complaints and disputes spike.
Why vanity counts fail: what residents actually complain about (and what predicts it)
Most package room metrics reports start with volume: total packages received, packages picked up, packages per unit, deliveries per carrier. Those numbers are easy to pull and easy to graph, but they rarely predict the moment your team gets buried in complaints. A building can process a high package count with few issues, or a modest count with constant friction, depending on how packages move (or do not move) through intake, storage, notification, and pickup.
Residents do not complain about your package room because you had 312 deliveries. They complain because something about the experience failed: a package was “delivered” but not findable, pickup took too long, the notification was wrong, or the desk could not answer “where is it” confidently. The package room metrics that matter are leading indicators of those failures: how long packages sit, how often intake data is incomplete, how often items get handled more than once, and how reliably the room’s zoning logic is followed.
If you want mailroom KPIs that map to resident experience, start from the complaint and work backward to the first measurable sign of trouble. That is how you stop reporting numbers that look busy and start reporting numbers that change behavior.
- Vanity counts tell you activity (how much), not risk (what is about to break).
- Resident complaints cluster around delay, confusion, lines, and disputes; each stage has a measurable early warning signal.
- The most useful package room metrics point to a specific lever: a script at intake, a shelf layout change, a carrier drop-zone tweak, or a staffing adjustment.
The resident complaint funnel: delay → confusion → line → dispute
Most package-room blowups follow a predictable path. A few packages linger longer than usual (delay). Then residents get partial or incorrect information (confusion). Confusion turns into repeat visits, emails, and “can you check again?” interruptions, which slow down the desk and create lobby backups (line). Finally, once a resident has spent enough time looking or waiting, the situation escalates into a formal complaint, a chargeback request, or a missing-package dispute (dispute).
The key point: by the time you are tracking “number of complaints,” you are already late. Leading indicators show the conditions that create complaints days or hours earlier. For example, average dwell time packages creeping up for one carrier is a warning that your intake flow or storage capacity is slipping. A rising unknown unit rate is a warning that wrong notifications and manual follow-ups are about to spike. A higher second-touch rate is a warning that the room is getting reworked, increasing misplacement risk and slowing pickups.
When you measure leading indicators daily, you catch the funnel at “delay” and “confusion,” when fixes are inexpensive: re-labeling a shelf zone, tightening an intake checklist, adjusting a peak-hour handoff, or changing where certain carriers drop.
A one-page translation table: complaint type to the metric that would have warned you
Use this translation table to connect resident language to operator signals. The goal is not to measure everything; it is to measure the few package room metrics that reliably forecast the next complaint category and point to a workflow change.
If you are already tracking mailroom KPIs, compare your list to the table. If a KPI does not help you answer “what do we change tomorrow morning,” it is probably a vanity count.
Complaint-to-metric translation (keep this as a one-page reference):
1) “It says delivered, but you do not have it.”
Warning metrics: mis-sort rate; second-touch rate; re-scan rate (corrections and gaps)
What it usually means operationally: packages are landing in the wrong zone, being moved during overflow, or being re-processed without a clean audit trail.
2) “I never got a notification” or “the notification had the wrong unit/name.”
Warning metrics: unknown unit rate at intake; re-scan rate; dwell-time tail (24/48-hour unpicked)
What it usually means operationally: intake data is incomplete, staff are guessing unit numbers, or exceptions are not being tagged for follow-up.
3) “Pickup took forever” / “there was a line.”
Warning metrics: package retrieval time during peak; peak hour staffing signal; second-touch rate (room rework slows the desk)
What it usually means operationally: staffing is mismatched to arrival and pickup bursts, or the room layout forces too much searching.
4) “You gave me the wrong package.”
Warning metrics: mis-sort rate; re-scan rate; retrieval time (rushed handoffs)
What it usually means operationally: shelf zoning is unclear, labels are hard to read, or staff are skipping identity checks under pressure.
5) “My package has been here for days” / “you are holding my deliveries.”
Warning metrics: average dwell time packages (by carrier/daypart); dwell-time tail after 24/48 hours
What it usually means operationally: intake batching delays, carrier-specific backlog, notification timing gaps, or overflow processes that hide items.
6) “I have emailed twice and nobody can tell me where it is.”
Warning metrics: second-touch rate; re-scan rate; unknown unit rate
What it usually means operationally: exceptions are handled informally (memory-based), not logged consistently; packages are moved without an explicit reason tag.
7) “The package room is a mess / unsafe / things go missing.”
Warning metrics: second-touch rate; mis-sort rate; dwell-time tail (clutter amplifier)
What it usually means operationally: overflow is unmanaged, the ‘one place only’ rule is broken, and older items are piling up, increasing search time and loss risk.
How to set targets without inventing benchmarks: compare to your own baseline by day of week
It is tempting to ask, “What is a good average dwell time packages number?” or “What is an acceptable mis-sort rate?” The problem is that targets pulled from generic benchmarks ignore your building’s constraints: carrier mix, locker capacity, staffing model, access hours, and even elevator traffic. Instead, set targets using your own baseline, then improve in controlled steps.
A practical approach for package room metrics is to baseline by day of week and by peak periods. Mondays often behave differently than Thursdays. The day after a holiday behaves differently than a normal Tuesday. If you compare everything to a single weekly average, you will either overreact or miss real issues.
Here is a simple target-setting method that keeps the math light and the behavior change clear: (1) Track each KPI daily for two to four weeks. (2) Create a baseline range for each day of week (for example, your typical Tuesday dwell time tail and typical Saturday retrieval time). (3) Set a “watch” threshold slightly above your normal range and an “action” threshold where you commit to a specific fix (staffing shift, intake checklist reinforcement, overflow rule change). (4) Review the same day next week after the change to confirm the metric moved in the right direction and the complaint type cooled off.
The core 6–8 package room metrics that predict complaints (and the workflow change each one drives)
Most package room metrics fail because they are reported as totals (deliveries per day, pickups per day) instead of signals that something is about to break (delays, confusion, rework, lines). The goal of these mailroom KPIs is simple: each one should point to a specific lever you can pull in policy, layout, staffing, or intake discipline.
paragraphs
For each KPI below, define “good” as your own baseline by day of week and season, then watch for sustained drift (3–5 business days) and sharp spikes (same-day exceptions). The only targets you need at first are: improve week-over-week and reduce variability during peak periods.
- Rule of thumb: if a metric does not clearly map to one workflow change, it is a vanity count.
- Segment whenever possible (carrier, daypart, and shift) so you can fix the cause instead of blaming volume.
- Keep formulas consistent. Changing definitions midstream hides problems and trains teams not to trust the numbers.
1) Average dwell time packages, segmented by carrier and by daypart (leading delay indicator)
What it predicts: “My package has been here for hours/days and I never got notified,” plus the downstream effects of overcrowded shelves and rushed handoffs.
Definition (use the simplest version you can sustain): average time from intake scan (or logged received time) to resident pickup time.
Formula: Average dwell time = average(pickup timestamp − intake timestamp). Segment it two ways: by carrier (UPS/FedEx/USPS/Amazon/other) and by daypart (morning deliveries vs afternoon/evening). Why: different carriers arrive in different waves and may require different intake handling (bulk drops, mixed labels, oversized items).
What “good” looks like (without fake benchmarks)
Your best-performing carrier/daypart combination is your internal standard. Start by identifying the “fast lane” (lowest dwell time) and then bring the slow lane closer to it. Also watch variability: if dwell time swings wildly day to day, residents experience it as unpredictability (more complaints) even if the average is acceptable.
Workflow levers this metric should drive
If dwell time is high for one carrier or one daypart, change the process where that carrier hits your system:
– Carrier-specific drop zone and batching: create a clearly labeled lane where that carrier’s deliveries land, then process in consistent batches (e.g., every 30 minutes) instead of sporadically.
– Intake script and label discipline: standardize what staff must capture before shelving (unit, name match, exception tag). When intake quality improves, dwell time typically drops because fewer items become “stuck” as exceptions waiting for research or correction.
2) Dwell-time tail: percent still unpicked after 24/48 hours (the complaint multiplier)
What it predicts: the “it was delivered but now it’s missing” dispute pattern, plus shelf congestion that increases mis-sorts and second touches.
Definition: share of packages still in your room past a time threshold.
Formula: 24-hour tail = (count of packages with dwell time > 24 hours) / (total packages received in the last 24 hours). Repeat for 48 hours. (Pick the windows that match your property’s reality; the point is to track the long tail.)
What “good” looks like
A shrinking tail and fewer “stale” piles. Even if your average dwell time looks fine, a growing 24/48-hour tail usually means exceptions are accumulating: unknown units, resident not found, lockers full, oversize overflow, or missed notifications. Residents in the tail are the ones most likely to complain.
Workflow levers this metric should drive
– Daily exception sweep: assign one person per shift to clear exception-tagged items (missing unit, name mismatch, damaged label) so they do not become orphaned.
– Resident messaging tied to reality: if weekend pickups lag, adjust pickup reminders or hours rather than forcing staff into risky shortcuts. Tail metrics tell you whether you need a “nudge” policy or an operational change (hours, access, overflow).
– Overflow rules: if the tail grows because shelves are full, define a single overflow zone with the same scan/label rules, not “temporary” piles.
3) “Unknown unit” rate: packages with missing/invalid unit at intake (predicts wrong notifications and manual follow-up)
What it predicts: wrong or no notifications, manual detective work, and resident frustration (“Why did I get a notice for a package that isn’t mine?”).
Definition: percentage of incoming packages that cannot be confidently tied to a unit at intake.
Formula: Unknown unit rate = (count of packages flagged “unknown unit/invalid unit”) / (total packages received).
What “good” looks like
Low and stable, with spikes that have an obvious cause (new residents, a directory change, a carrier label issue, or a local retailer formatting problem). The key is not perfection; it’s rapid identification and resolution before the package sits and becomes a dispute.
Workflow levers this metric should drive
– Intake verification script: require staff to confirm a unit before shelving (e.g., match name/unit to your resident list; if missing, tag as exception immediately).
– Exception categories that are usable: “unknown unit,” “unit unreadable,” “name not in directory,” “multiple possible matches.” If categories are too vague, the fix turns into guesswork.
– Directory hygiene: set a weekly cadence to update resident names, preferred names, and move-in/move-out status so intake staff have a reliable source of truth.
4) Second-touch rate: percent of packages moved or re-handled before pickup (predicts loss and labor spikes)
What it predicts: lost items, broken chain-of-custody, and sudden labor load (“Why are we always reorganizing?”). Every extra touch is a chance to misplace something or forget to update its location.
Definition: percentage of packages that are handled more than once after intake before resident pickup (moved to overflow, re-shelved, re-sorted, transferred between staff).
Formula: Second-touch rate = (count of packages with 2+ handling events) / (total packages received). If you cannot instrument every move, track a simpler proxy: count items moved during “reorganization” blocks and divide by daily intake volume.
What “good” looks like
A room where most items go from intake to one assigned home to pickup. If second-touch grows, your “system” is really a series of temporary piles—complaints and disputes typically follow.
Workflow levers this metric should drive
– “One place only” zoning: define zones (by floor, building, alpha range, locker vs shelf, oversize) and do not allow ad-hoc stacking outside them.
– Overflow policy with scan/QR-label rules: overflow should be a defined zone with the same labeling and location discipline as primary shelving. Otherwise overflow becomes a black hole that drives second touches and missing-package claims.
– Intake pacing: if second-touch spikes after big drops, you may be shelving too fast. Slowing intake slightly to capture accurate unit/location often reduces total labor by eliminating rework.
5) Mis-sort rate: packages placed in the wrong zone/shelf (predicts “it says delivered but I can’t find it”)
What it predicts: the classic complaint where tracking shows delivered, your system shows received, but staff cannot locate it quickly. Mis-sorts also inflate retrieval time and trigger unnecessary rescans and second touches.
Definition: percentage of sampled packages found in an incorrect location relative to your stated shelf logic.
Formula (practical): Mis-sort rate = (count of packages found in wrong zone during audit sample) / (total packages checked). Use a daily or near-daily spot check rather than attempting a full inventory.
What “good” looks like
Stable and low enough that staff can confidently troubleshoot: when something is missing, it is truly an exception, not “probably on the wrong shelf.” The moment staff stop trusting the shelf logic, they start creating shortcuts (unlogged piles), which worsens everything else.
Workflow levers this metric should drive
– Simplify shelf logic: fewer zones beats clever zones. If you have too many categories, mis-sorts rise during rush periods.
– Visual controls: big, legible zone labels; consistent shelf numbering; clearly defined oversize area. When new or cross-trained staff can understand the layout in 60 seconds, mis-sorts drop.
– Two-step placement during peak: one person scans/labels, the other shelves. Even temporarily doing this during peak arrivals can reduce mis-sorts and rework.
6) Re-scan rate: percent requiring a second scan to correct data (predicts desk interruptions and audit gaps)
What it predicts: constant front-desk interruptions (“Can you fix this label?”), weak audit trails, and increased time spent hunting for packages. Re-scan rate is also an early warning that intake standards are slipping.
Definition: percentage of packages that require a second scan/edit because the first record was incomplete or wrong (wrong unit, wrong carrier, wrong resident match, missing photo if your process uses it, duplicate entry, etc.).
Formula: Re-scan rate = (count of packages with a correction scan/edit) / (total packages received). If your tools do not track edits cleanly, log “correction needed” as a simple tally by shift.
What “good” looks like
Occasional corrections, not a steady stream. Watch for clustering by shift or by new staff. Re-scan rate usually rises before resident complaints because residents only notice when the error blocks pickup or triggers a wrong notification.
Workflow levers this metric should drive
– Intake checklist (minimum required fields): make it explicit what cannot be skipped (unit, last name match, exception tag, location).
– Training trigger: if re-scan spikes, do a 10-minute refresher on the most common errors (unit formatting, name matching, how to tag unknown units) and temporarily slow intake for accuracy.
– Reduce ambiguity: standardize unit formats (e.g., “1207” not “12-07” or “12 07”) to avoid preventable corrections.
7) Package retrieval time: door-to-handoff time during peak periods (predicts lobby lines and negative reviews)
What it predicts: long lines, frustrated residents, and staff skipping steps to move the line (which later creates disputes).
Definition: time from when a resident requests a package (arrival at desk/scan-in for pickup) to successful handoff.
Formula: Retrieval time = handoff timestamp − request timestamp. Track during peak periods specifically, because off-peak retrieval can look great while peak retrieval is where complaints are born.
What “good” looks like
Consistent peak performance. Residents tolerate a short wait; they do not tolerate unpredictability or being told to “come back later” because the room is unsearchable.
Workflow levers this metric should drive
– Pickup flow design: a clear queue, a dedicated “runner” during peak, and a single script (verify identity, pull item, confirm handoff).
– Improve findability: if retrieval time is high but mis-sort is low, your layout may be too dense or your zones are not aligned to how staff search (e.g., mixing oversize with regular shelves).
– Appointment windows or pickup rules (where appropriate): if peak crushes the desk, define resident-friendly pickup windows that match staffing reality rather than relying on heroic effort.
8) Peak hour staffing signal: arrivals per 15 minutes vs. available hands (predicts line formation and shortcuts)
What it predicts: the moment your operation will tip into shortcuts—unlabeled piles, skipped scans, and rushed handoffs. Those shortcuts are the real root cause behind many later disputes.
Definition: delivery arrival rate during the busiest windows compared to the number of staff available to process intake and pickups.
Formula (simple): Peak staffing signal = (packages arriving per 15 minutes + pickup requests per 15 minutes) / (staff available for package tasks). You do not need perfect counts—directionally correct is enough to flag “we’re under-resourced at 4–6pm” or “carrier drops overwhelm us at noon.”
What “good” looks like
A signal that stays within your team’s capacity most days, with planned adjustments during known surges (move-in weekends, holidays, Mondays after a long weekend). If the signal frequently spikes, your process will degrade no matter how good your staff is.
Workflow levers this metric should drive
– Peak hour staffing: shift one role for a 60–90 minute window to cover intake or pickups when the signal predicts overload.
– Carrier coordination: if one carrier creates predictable spikes, create a dedicated drop lane and a defined processing window so the desk does not get crushed unpredictably.
– Protect the scan step: when the staffing signal spikes, teams tend to skip scanning or exception tagging. Make “no scan, no shelf” non-negotiable, and instead adjust staffing or batching to match reality.

How to measure these mailroom KPIs in 15 minutes a day (without a new reporting project)
You do not need a new dashboard build to get useful package room metrics. You need a repeatable, low-friction routine that creates comparable data day to day. The goal is not perfect counts; it is early warning. When dwell time, mis-sort rate, or re-scan rate starts drifting, you catch it before resident complaints spike.
The fastest approach is a small daily “operator check” that combines: (1) a quick intake sanity check, (2) a short spot-sample of recently handled packages, and (3) a few timed pickups during your real peak window. Keep it consistent so trends are real, not artifacts of who measured what. Do it at the same time each day, using the same definitions, and assign a single owner per shift.
- Timebox it: 15 minutes total, no exceptions. If you miss a day, do not “make up” data—resume tomorrow.
- Use the same definitions every day (e.g., what counts as a re-scan, what counts as an unknown unit). Write them at the top of the checklist.
- Prefer sampling over full counts: 30 packages and 5 pickups is enough to spot drift quickly.
- Measure what you can change this week: if a metric cannot drive a workflow or policy change, it does not belong in the daily routine.
- Avoid metric gaming: your process should make it easier to record exceptions than to hide them.
The 15-minute daily cadence: same time, same steps, same owner
Pick one daily checkpoint time that reflects how your operation actually runs. Many buildings choose shortly after the main carrier drop window, when the room has “fresh” activity but before pickup traffic peaks. If your biggest pain is pickup lines, run this check 10–15 minutes before your typical rush so you can adjust immediately.
Assign ownership by role, not by person. For example: “AM front desk lead owns weekdays; weekend concierge owns weekends.” If the owner changes, the method stays identical. Consistency is what makes the package room metrics comparable and useful.
A simple cadence that fits in 15 minutes: (1) 3-minute intake sanity check, (2) 7-minute 30-package spot check, (3) 5-minute peak pickup timing (either now or scheduled for the next peak hour). If you cannot do the pickup timing at that moment, schedule it in the same daily window (e.g., 5:30–6:00 pm) and record it on the same line of the log.
What to capture at intake: scan fields, QR-label checks, and exception tagging
Most complaint-driving problems start at intake: missing unit numbers, mismatched names, or packages routed to the wrong zone because the label was unclear. You are not auditing every package—just confirming that your intake is producing usable data.
During the daily check, watch 5 consecutive intakes (or review the last 5 intakes if you are solo). For each, confirm the minimum fields are captured consistently and exceptions are tagged immediately instead of being handled “later.” This is where unknown unit rate and re-scan rate often originate.
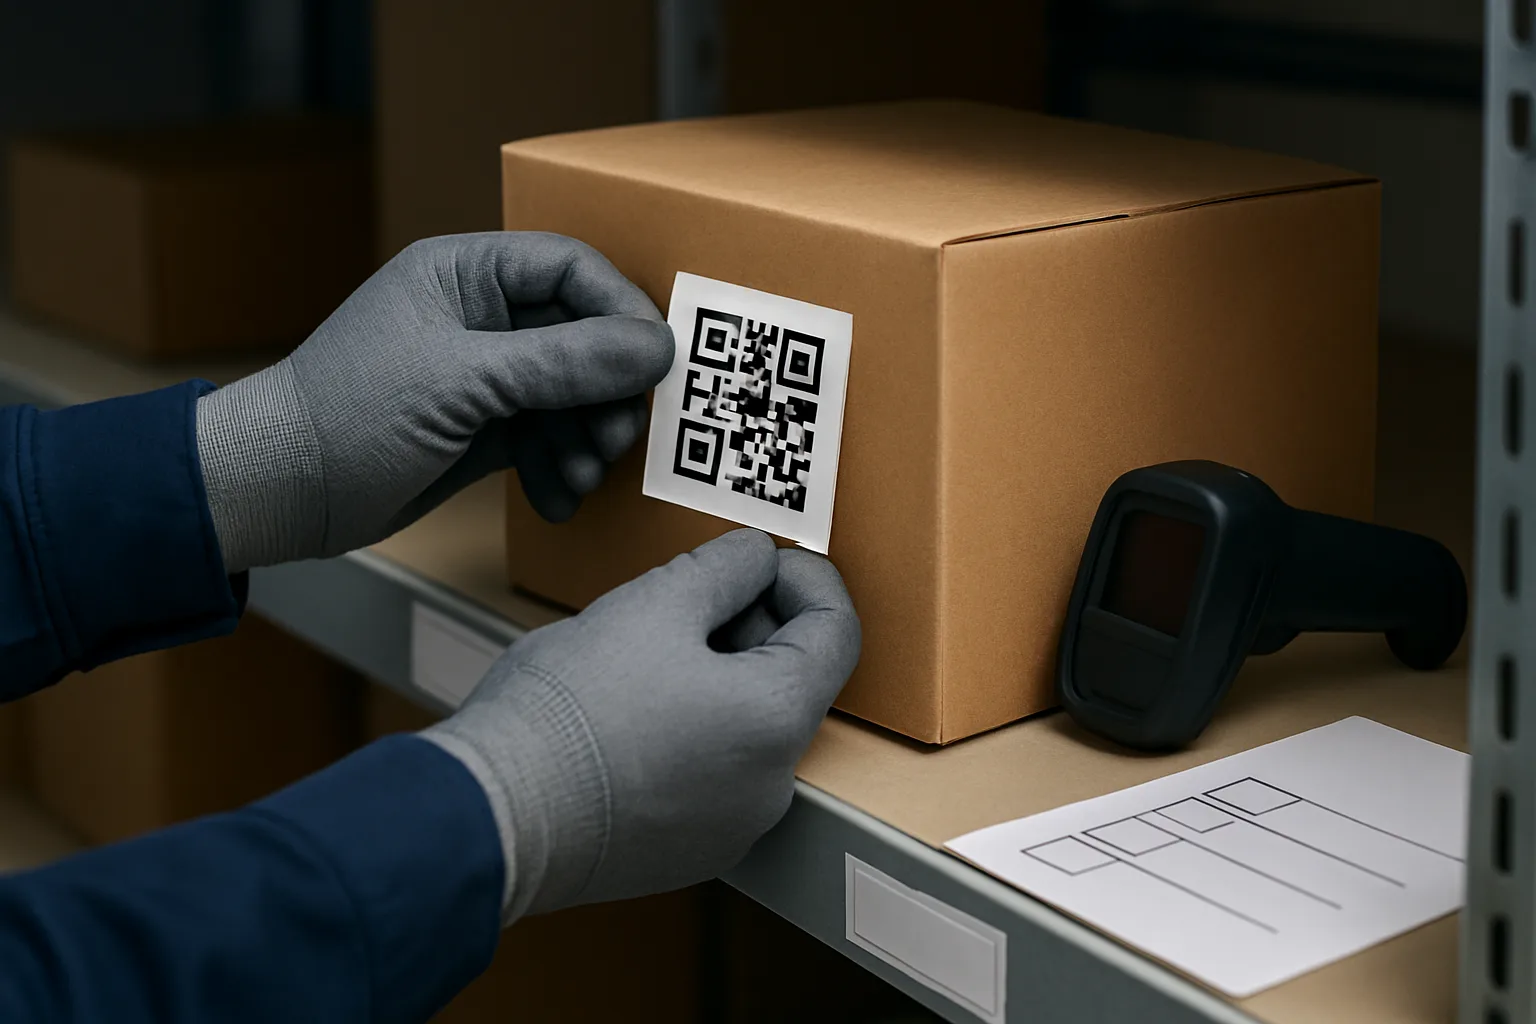
If you use QR labels or internal shelf tags, the daily check is simply: “Is the label applied the same way every time, and does it match the location it was placed?” A sloppy label habit inflates second-touch rate and mis-sort rate later because staff have to move items to re-label or re-zone them.
How to sample: 30-package spot check to estimate mis-sort, re-scan, and unknown unit rates
Sampling keeps the routine light while still surfacing bottlenecks. The key is to sample the same way every day so you are not accidentally cherry-picking “easy” shelves.
How to pull the sample: take 30 packages that were received in the last 24 hours (or since yesterday’s check). If your room is zoned, pull 10 from each of three different zones (for example: lockers/secure, open shelving, oversized). If you are not zoned, pull from three different physical areas so you are not sampling only one shelf that one person maintains.
For each sampled package, record three yes/no checks: (1) Unknown unit? (missing/invalid unit or resident cannot be matched), (2) Mis-sort? (package is not in its intended zone/shelf logic), (3) Re-scan? (the record required a correction scan or data edit after initial intake). You are not trying to reconstruct the whole story—just counting exception signals that predict resident issues (wrong notifications, “delivered but not found,” and desk interruptions).
How to time retrieval: 5 timed pickups during peak window
Package retrieval time is best measured during the moments residents actually feel friction: the start of the evening rush, right after work, or whatever your building’s peak hour is. Measuring at a quiet time will understate the problem and mask staffing or layout issues.
Time 5 real pickups (not practice runs) from the resident’s perspective: start the timer when the resident arrives at the pickup point (or joins the line) and stop when the package is handed off and the interaction is complete. If your process includes identity verification, that stays in the time—because residents experience it as part of pickup.
Write one short note when timing runs long (one reason only): “searching shelf,” “manual lookup,” “package not found,” “needs re-scan,” “overcrowded counter,” “handoff interrupted.” Those notes help connect retrieval time back to the upstream package room metrics like mis-sort rate, unknown unit rate, and second-touch rate.
A minimal daily log template (fields only): carrier, timestamp, exception reason, second-touch flag
Keep the log so small that it actually gets used. One page per day is enough. The point is to create a consistent trail of operational signals—especially exceptions—without turning the front desk into a data-entry job.
Below is a minimal field list you can replicate in a notebook, shared sheet, or printed checklist. Use checkboxes where possible so it stays fast, and reserve free-text for a short “exception reason” only when something goes wrong.
Reading the dashboard like an operator: what each metric is telling you to change this week
Package room metrics only help if they translate into a specific change you can make before residents feel the impact. The goal is not to “report numbers,” but to spot the first operational crack (intake, labeling, zoning, staffing, or resident communication) that will become tomorrow’s complaints.
Use this section as an if/then playbook. Read your mailroom KPIs the same way you would read a maintenance work order queue: identify where the friction starts, pick the smallest fix that removes it, and confirm the metric moves within a few days. Keep the focus on leading indicators like average dwell time packages by carrier, unknown unit rate, and second-touch rate, because those are the early warnings that precede “missing package” disputes and front-desk pileups.
- Operator mindset: one metric spike = one hypothesis = one change to test this week
- Always segment before reacting: carrier, daypart, and intake shift (who was working)
- Fix the process before you add labor: staffing changes help, but only after the workflow stops creating rework
- Look for paired signals: mis-sort rate + re-scan rate together usually points to intake quality, not resident behavior
- Close the loop: every change should have an owner and a date you expect the metric to improve
If dwell-time spikes by one carrier: intake batching, carrier lane, and notification timing fixes
What it usually means: packages from one carrier are sitting longer because they arrive in a hard-to-process condition (labels folded, multiple drops, inconsistent unit formatting), they land during a staffing gap, or they are being staged “temporarily” and never fully put away. Residents feel this as delayed notifications, “delivered but not available,” or inconsistent availability times.
What to check first (5-minute triage): confirm whether the carrier’s deliveries arrive as one bulk wave (e.g., a large afternoon drop) and whether those items are being fully scanned and shelved immediately or stacked for later. If the dwell-time tail (still unpicked after 24/48 hours) rises at the same time, you are not just slow, you are accumulating backlog.
Operational fixes to test this week
If average dwell time packages is higher for a specific carrier, try one of these workflow levers (pick one, not five):
1) Create a carrier lane or drop zone with a clear rule: “Carrier X goes on this cart/shelf only until scanned and shelved.” This prevents mixing and reduces searching.
2) Batch intake by carrier and stop mid-stream interruptions. Example: during the main delivery wave, the front desk runs a 12-minute “intake block” where one person scans/labels continuously while another handles resident questions.
3) Adjust notification timing: if your process sends notifications at scan time but scanning is delayed, you create a gap residents interpret as missing packages. Set a policy that notifications only go out when the item is fully placed in its final zone (not on a staging table).
4) Add a carrier-specific exception tag: for labels that frequently arrive unreadable or missing unit, tag them immediately instead of letting them age on a counter. That converts dwell-time into a known exception workflow rather than silent delay.
What to watch after the change: dwell-time by carrier should drop first; the 24/48-hour tail should shrink next. If dwell-time drops but retrieval complaints rise, you fixed intake speed but created location confusion (go check mis-sort rate and signage).
If unknown unit rate rises: front-desk verification script and resident directory hygiene
What it usually means: intake is spending time guessing, residents are getting wrong or no notifications, and your team is creating manual follow-up work that will later show up as “I never got notified” disputes. Unknown unit rate is one of the best early predictors of future resident frustration because it forces judgment calls at the desk.
What to check first: look at the exception reasons. Are unknowns mostly missing unit numbers, illegible labels, name mismatches, or new move-ins not yet in your directory? Also note whether the spike aligns with a specific carrier or a specific staff member/shift.
Operational fixes to test this week
If unknown unit rate increases, use these policy/workflow levers:
1) Use a standard verification script at intake (consistent, fast, non-negotiable): “No unit number = exception tag now.” Do not “park it and hope.”
2) Require a minimum data set before shelving: resident last name + unit (or a verified directory match). If either is missing, it goes into an exceptions bin with a timestamp.
3) Tighten resident directory hygiene: set a weekly 10-minute routine to reconcile new move-ins, name changes, and common nicknames. Unknown units often track directly to outdated rosters.
4) Resident messaging that prevents repeats: a short building message during high-volume weeks reminding residents to include unit numbers and current names for deliveries. (Keep it operational: what to do, not a lecture.)
5) Carrier-facing signage where feasible: a simple sign at the drop area that says “Unit number required on all labels” won’t fix everything, but it can reduce the repeat offenders.
What to watch after the change: unknown unit rate should fall within days. If it falls but re-scan rate rises, staff may be forcing data entry corrections later; adjust the intake script so exceptions are tagged cleanly instead of “fixed” inconsistently.
If second-touch rate climbs: overflow policy, labeling discipline, and “one place only” zoning
What it usually means: packages are being handled more than once before pickup. That is pure risk and pure labor. Second-touch rate predicts losses, misplacements, and resident-facing delays because every move is a chance to break chain-of-custody, remove a label, or put an item in the wrong zone.
Common causes: overflow areas without rules, staging tables that become storage, unclear zoning (“small packages here, unless full”), or inconsistent QR-label placement that falls off during handling.
Operational fixes to test this week
If second-touch rate rises, make one of these changes:
1) Enforce “one place only” zoning: a package is either in its final shelf location or in a clearly labeled exceptions/overflow zone with a time limit. No third category.
2) Create a defined overflow policy before you need it: when shelf A is full, overflow goes to shelf A-Overflow (not “anywhere”). Include a rule for when overflow gets reconciled back to primary shelves (e.g., first 10 minutes of each shift).
3) Tighten labeling discipline: QR-label (or internal label) goes on a consistent spot (front-right corner, not on tape seams). If labels fall off, second-touch climbs because staff have to re-identify items.
4) Use a cart-to-shelf handoff checklist: if a cart is used for staging, it must be emptied and reconciled by a set cutoff time. A cart that lives overnight is second-touch waiting to happen.
What to watch after the change: second-touch rate should decrease quickly. If it doesn’t, you likely have a layout problem (insufficient space, poor shelf logic) that forces movement no matter what policy you set.
If mis-sort and re-scan rise together: retraining trigger and a two-person check during peak arrivals
What it usually means: intake accuracy is breaking down at the same time data quality is breaking down. Mis-sort rate predicts “it says delivered but I can’t find it.” Re-scan rate predicts desk interruptions, audit gaps, and time spent correcting records instead of moving packages. When they rise together, you’re seeing rushed intake or unclear standards, not random mistakes.
Where this happens: peak delivery windows, shift change, or when one person is trying to intake while also handling residents at the counter.
Operational fixes to test this week
If mis-sort rate and re-scan rate climb in the same week, treat it as a training/process trigger:
1) Run a 10-minute refresher on your intake standard work: scan steps, what fields must match the label, where the QR-label goes, and how zones are assigned. Keep it practical: show two real packages and do it live.
2) Add a two-person check during the heaviest 30 minutes of arrivals: one person scans/labels, the other places items into zones. This reduces cognitive switching and errors.
3) Simplify shelf logic: if zones are too granular (too many categories), mis-sorts increase. Consolidate to fewer zones with clear signage, then add detail later.
4) Create a “no correction without a note” rule: if a package needs a re-scan/correction, the staff member records the reason (e.g., missing unit, name mismatch, duplicate scan). That prevents silent fixes that hide process defects.
5) Control interruptions: designate a small “help counter” window for resident questions during intake surge, or post a sign: “Intake in progress until 3:15; pickups continue as normal.” The point is to reduce multitasking.
What to watch after the change: re-scan rate should drop first (fewer corrections). Mis-sort rate should drop next (better placement). If re-scan drops but mis-sort stays high, your zoning/signage is the problem, not scanning.
If retrieval time increases: queue design, pickup appointment windows, and peak hour staffing adjustments
What it usually means: residents are waiting longer from “I’m here” to “package in hand,” which is where complaints become public (lobby frustration, negative reviews, heated desk interactions). Package retrieval time is often driven by layout and handoff clarity as much as staffing.
Common causes: staff searching because shelves are inconsistent, residents arriving in a tight time window, bottlenecks at a single door or counter, or pickups competing with intake at the same station.
Operational fixes to test this week
If package retrieval time rises during peak periods, try these levers:
1) Redesign the queue: separate “pickup line” from “questions/problem packages.” A single resident with an exception can stall everyone.
2) Pre-stage high-volume zones: during the 10 minutes before peak pickup, straighten and face the most-used shelves so staff can locate items quickly. Small reset, big impact.
3) Add a pickup window policy (lightweight): if your building allows, suggest residents pick up after a stated “ready by” time tied to your intake completion, reducing the rush of “it was delivered 2 minutes ago.”
4) Create a fast path for QR-label matches: if staff can scan a code and go directly to a zone, protect that flow by keeping zones consistent and clearly labeled.
5) Adjust peak hour staffing based on the signal, not habit: if arrivals per 15 minutes routinely exceed what one person can intake plus handle pickups, schedule a second person for that narrow window. This is more efficient than adding an extra hour of coverage at the wrong time.
What to watch after the change: retrieval time should improve immediately if the fix addressed queue flow or shelf logic. If retrieval time improves but mis-sort complaints rise, you sped up handoffs without fixing accuracy; revisit zoning and mis-sort controls.
Make it stick: weekly review, accountability, and dispute-proofing
Package room metrics only reduce resident complaints if they stay consistent through staffing changes, busy Mondays, and holiday surges. The goal here is not a perfect dashboard; it is a repeatable operating rhythm where mailroom KPIs translate into two concrete changes each week, with a named owner and a paper trail that prevents disputes from turning into refunds or bad reviews.
Use this section as your “operating system”: a 30-minute weekly review, baseline-based triggers (so you are not chasing made-up benchmarks), a tight accountability loop between shifts, and simple dispute-proofing habits that make package handoffs defensible. You will keep tracking the same package room metrics, but you will start managing them like operations—through ownership, checklists, and escalation rules.
- Core principle: measure less, act more. If a metric does not change a policy, layout, staffing, or intake script, remove it.
- Standardize definitions. “Second-touch,” “unknown unit,” “mis-sort,” and “re-scan” must mean the same thing to every person, every shift.
- Bias toward leading indicators. Volume can explain why a day was hard; it rarely tells you what to fix before complaints spike.
- One owner per action. Shared ownership is how problems survive week after week.
Weekly scorecard: 8 metrics, 3 notes, 2 actions, 1 owner
Run a standing 30-minute meeting at the same time every week (often midweek, after Monday/Tuesday volume settles). Bring one page. Do not turn it into a debate about edge cases; focus on what changed and what you will do differently next week.
A practical format that keeps package room metrics tied to resident experience is: 8 metrics, 3 notes, 2 actions, 1 owner. The “8 metrics” are the same ones you track daily (for example: average dwell time packages by carrier, dwell-time tail after 24/48 hours, unknown unit rate, second-touch rate, mis-sort rate, re-scan rate, package retrieval time during peaks, and peak hour staffing signal). The point is consistency—trend lines beat one-off stories.
Trigger thresholds based on your baseline (not industry stats)
Avoid copying “ideal” targets from other buildings. Your resident mix, carrier behavior, access rules, and room layout are different. Instead, set trigger thresholds using your own baseline by day of week and season, then escalate when you exceed it.
A simple method that works without advanced analytics: for each metric, write down your typical range for the last 4–6 weeks (separately for weekdays vs. weekends if needed). Then define a trigger as either (a) two consecutive days outside the range, or (b) one day far outside the range plus an operational change you can point to (staffing gap, elevator outage, big move-in day).
Examples of baseline-based triggers that are operationally meaningful: average dwell time packages rises for one carrier for two days in a row; dwell-time tail after 48 hours jumps noticeably; unknown unit rate increases after directory changes; second-touch rate climbs during overflow days; package retrieval time during the peak window stretches enough to cause visible lines. Your triggers should always answer: “What complaint is about to happen if we do nothing?”
Accountability loop: shift handoffs, checklists, and exception follow-ups
Most package-room failures are not single mistakes; they are broken handoffs. Fix that with a short, mandatory loop between shifts that treats exceptions (unknown unit, damaged, oversized, locker full, access restriction) as work items that must be closed—not anecdotes someone mentions if they remember.
Use three lightweight controls that do not require new software:
1) Shift handoff note: one paragraph at shift end that states (a) what is overflowing, (b) which carrier had issues, (c) what exceptions are unresolved, and (d) what the next shift must do first. Keep it consistent so it can be scanned in 30 seconds.
2) Package room checklist: a short list for intake and for pickup hours (label placement, zone placement rule, re-scan rule, “unknown unit” handling rule, overflow rule). The checklist is also your training tool.
3) Exception follow-up queue: a simple list (paper or shared doc) of unresolved exceptions with an owner and a next attempt time. Example items: “unknown unit—verify in resident directory,” “carrier label unreadable—re-scan/re-label,” “oversized—move to designated zone and update location.” If the queue exists, exceptions stop disappearing into memory.
Dispute-proofing basics: chain-of-custody notes, photo rules (if used), and consistent exception categories
Disputes are rarely solved by arguing. They are solved by records that show a consistent process. Your goal is not surveillance; it is defensible chain-of-custody that reduces time spent in “he said/she said” loops and makes it easier to locate items fast.
Start with three dispute-proofing habits tied directly to your package room metrics:
Consistent exception categories: define a short list and never invent new labels on the fly. For example: unknown unit, unreadable label, damaged, oversized, locker full/overflow, access restricted, mis-sort corrected, resident refused/return to sender. This turns your “exceptions” into data you can act on (and reduces re-scan rate and second-touch rate over time).
Chain-of-custody notes at the moment of deviation: if a package is moved (second-touch) or corrected (re-scan), require a short note that answers: who, when, why, and where it went. This is the fastest way to resolve “delivered but not found” complaints and to diagnose mis-sort rate patterns.
Photo rules (only if you already use photos): keep them minimal and consistent—capture the label and the placement context when an exception occurs (unknown unit, damaged, or overflow relocation). Do not make photos a requirement for every package if it slows intake; use them where they prevent disputes. Whatever you choose, document the rule so staff do not improvise under pressure.
Seasonal readiness: how to adjust peak hour staffing and overflow before holidays
Seasonality is where good buildings lose control: more arrivals, more overflow, more new staff, and more shortcuts. The fix is to plan around the leading indicators you already track instead of reacting to complaint spikes.
Two weeks before your busy season, run a “stress test” review using your recent package room metrics:
Peak hour staffing: look at arrivals per 15 minutes versus available hands and compare it to the period when your package retrieval time was best. If retrieval time is already creeping up during normal weeks, you will not survive holiday volume without a staffing or schedule shift.
Overflow and second-touch: if second-touch rate rises whenever shelves get tight, you need an overflow policy before the surge (where overflow goes, how it is labeled, and the rule for moving it back). Overflow without a rule is the fastest path to mis-sort rate spikes and disputes.
Carrier-specific dwell time: if one carrier consistently drives average dwell time packages upward, set up a carrier lane/drop zone, a batching plan, and a notification timing habit now—before volume forces rushed intake.
Training readiness: holiday temps or cross-trained staff need one page: your zoning map, your exception categories, and your “no shortcuts” rules (unknown unit handling, re-scan discipline, and the one-place-only placement rule). Consistency is what keeps mailroom KPIs stable when people are new and the room is full.
Frequently Asked Questions
What is the minimum set of package room metrics I can track if my team is already stretched?
Track four leading indicators that surface problems early: 1) average dwell time packages (split by carrier), 2) percent unpicked after 24/48 hours (the dwell-time tail), 3) unknown unit rate at intake, and 4) second-touch rate (packages moved before pickup). These four tell you whether residents will feel delays, get wrong or missing notifications, and experience “delivered but not found” disputes. Add mis-sort rate and peak-hour retrieval time only after the basics are stable.
How do I measure average dwell time packages if we do not have a reporting tool that calculates it?
Use a simple daily sample. Pick 10 packages per carrier (or the top 2–3 carriers in your building) from the shelves at the same time each day. Record: carrier, intake timestamp from the label/log, and whether it has been picked up. Dwell time is “now minus intake time.” You do not need perfect coverage—consistency matters more. Over a week, you will see which carrier and daypart creates the longest wait and whether your notification or shelving workflow is the real constraint.
What counts as an “unknown unit,” and how do we reduce the unknown unit rate without annoying carriers?
Unknown unit includes: missing unit/apartment, illegible unit, unit not in your resident directory, or a name-only label that matches multiple residents. Reduce it with two levers: (1) a front-desk intake script: “No unit, no shelf—go to exceptions,” then immediately attempt a quick directory match; (2) resident data hygiene: require unit and last name on deliveries in your resident welcome email and keep a simple move-in/move-out update checklist so the directory stays current. The goal is not to police carriers; it is to prevent wrong notifications and manual detective work later.
How do I calculate second-touch rate in a way that is fair and does not encourage hiding overflow?
Define second-touch narrowly: any package that is moved from its first assigned location before pickup (excluding a single deliberate move into a documented overflow zone). Measure it with a daily spot check: sample 30 packages and ask staff, “Was this placed once and stayed put?” Mark yes/no and the reason for any move (overflow, relabel, mis-sort fix, resident request). If second-touch is high, treat it as a layout and overflow policy issue—not a performance blame metric. The fix is usually clearer zoning, a dedicated overflow rule, and better labeling discipline at first placement.
We have package lockers and an open package room. Which mailroom KPIs still matter, and what changes?
The same leading indicators apply, but the definitions shift slightly. Dwell time should be segmented by “locker vs. room shelf,” because locker capacity can create artificial delays. Mis-sort becomes “wrong compartment/zone” (e.g., placed in room when it should be in a locker, or vice versa). Retrieval time should be measured separately for locker pickups (usually faster) and staffed handoffs (line risk). If locker capacity regularly forces overflow, your most predictive metric will be the 24/48-hour tail—because overflow packages are the ones residents dispute first.
How do I tie peak hour staffing to complaints without building a full staffing model?
Use a lightweight peak hour staffing signal: count arrivals per 15 minutes for your busiest window (often late afternoon) and compare it to “available hands” (people who can intake, label, shelve, and hand off without abandoning the desk). Then time five real pickups for package retrieval time during that window. If arrivals spike and retrieval time rises together, complaints will follow (lines, rushed handoffs, missed scans). The operational response is simple: shift one person’s schedule by 30–60 minutes, batch intake for a short window, or create a carrier-specific drop zone that reduces sorting time during the rush.

Standardize the daily routine so the metrics stay reliable
Choose your 6–8 package room metrics, assign an owner, and publish a one-page daily checklist that defines how your team logs unknown units, flags second touches, spot-checks mis-sorts, and times package retrieval during peak hour staffing windows. Consistency is what makes the numbers actionable—especially when the building gets busy or staffing changes.
Download a one-page daily package room KPI checklist
Run the mailroom like an operator: measure, spot the bottleneck, change one lever
If you want fewer resident complaints, stop waiting for the complaint to tell you what broke. A small set of package room metrics will surface the same problems earlier: dwell-time by carrier shows delays forming; the 24/48-hour dwell-time tail shows where frustration compounds; “unknown unit” rate predicts wrong or missing notifications; second-touch rate predicts loss risk and labor spikes; mis-sort rate predicts “delivered but can’t find it”; re-scan rate predicts desk interruptions and audit gaps; package retrieval time predicts lines; and the peak hour staffing signal predicts when shortcuts start.
Keep it lightweight and consistent: one owner, the same daily check time, a small spot-check sample, and a short note about what changed (carrier surge, overflow opened, new temp staff, directory update). Then do a weekly 30-minute review to pick two fixes: one process change (like intake verification or exception tagging) and one staffing/layout change (like a carrier-specific lane or a peak-hour shift). That cadence turns mailroom KPIs into resident-experience control—not just reporting.