

Seasonality is a baseline. Your biggest package spikes come from property events.
If you are doing package volume forecasting for apartments using only last year’s seasonal pattern, you are probably missing the days that actually break your operations. The worst backlogs usually show up when the building changes: a cluster of lease starts, a bulk unit turn, a renovation delivery drop, an elevator outage, a package-room closure, or an amenity launch that pulls residents into “new routine” ordering. Those events are knowable in advance, but they rarely get translated into a mailroom staffing forecast or shelf-capacity plan until packages are already stacked on the floor.
This guide introduces an event-based demand approach that onsite and regional teams can run without data science. The idea is simple: keep a shared property events calendar, assign each event a reasonable “daily package delta” for a short ramp-and-decay window, and add that delta to your normal baseline. From there, a lightweight worksheet converts forecasted arrivals into practical decisions: how many labor blocks you need at the desk and in the package room, how much shelf space you must have available, what overflow rules to pre-stage, and what carrier instructions to send before peak days.
You will see how to model common drivers like move-in forecasting, renovation delivery spikes, elevator downtime, and temporary closures as operational inputs rather than surprises. The goal is not perfect prediction. The goal is early warning—enough time to adjust staffing, storage, and handoff/checklist discipline so the surge never turns into a backlog.

Why Seasonality Misses the Surges: The Apartment Mailroom Is Event-Driven
If you plan package volume only by seasonality (holidays, back-to-school, weather), you will catch the slow rises but miss the fast, operational spikes that actually break a mailroom. In apartments, the biggest backlogs are usually triggered by property events: a cluster of move-ins, a construction phase that changes access, or a new amenity that quietly increases deliveries. These are not random. They are knowable in advance—often weeks in advance—if you plan around an event calendar instead of a calendar month.
Think of seasonality as your baseline and events as the multipliers. The baseline helps you estimate a typical Tuesday in March. Events explain why next Tuesday will be 2–3x volume, why pickups will slow down, or why carriers will drop in a different location. This is the mindset shift behind package volume forecasting for apartments: you are forecasting operations, not just demand.
The good news: you do not need a data science team to do event-based demand planning. Most of the signals already exist in your leasing, maintenance, and construction workflows. The missing piece is treating them as forecast inputs and translating them into “what it means for daily packages, staffing, and shelf space” before the surge hits.
- Seasonality answers: “What’s typical for this time of year?”
- Event-based demand answers: “What’s different about this week at this building?”
- You can know event-driven spikes earlier than seasonal spikes (because leasing and construction schedules are planned)
- Event-driven forecasting improves both volume and flow (arrivals, pickup friction, access constraints, and carrier behavior)
Seasonality sets the baseline, events create the spikes
Seasonality is real: holiday gifting, major sales periods, and weather-driven indoor shopping can lift volume across your portfolio. But seasonality usually moves gradually. You might see steady increases over a few weeks and can add staffing or overflow space with time to spare.
Mailroom failures tend to come from step-changes—volume jumps that happen in 24–72 hours. That is almost always event-driven. Examples: 12 lease starts hitting the same Friday, a bulk unit turn delivering fixtures all at once, a package room closure forcing temporary staging at the front desk, or an elevator outage that slows retrieval and pickup so packages sit longer.
In practice, the “peak day” you need to plan for is often tied to an event date, not a season. That is why a property can be overwhelmed in an otherwise normal month: the baseline was fine, but the event stacked multiple operational pressures on the same days.
What counts as an event: lease starts, unit turns, closures, downtime, launches
For forecasting, an event is anything that changes one of three things: (1) arrivals (more or fewer packages), (2) time-to-shelf (how quickly your team can receive and stage packages), or (3) time-to-pickup (how quickly residents can retrieve them). You are not only predicting how many parcels arrive—you are predicting how long they will remain on hand and how hard they are to process.
The most useful event types are the ones you can schedule, measure, and assign an owner to. They are also the ones that repeatedly show up in post-mortems when a package room gets jammed.
Signals you can track without data science (leasing reports, construction schedules, vendor calendars, amenity launch plans)
You already have “forecast-grade” signals; they are just stored in different places. Leasing knows lease starts and move-in dates. Maintenance knows elevator downtime and access changes. Construction knows delivery windows and staging constraints. Vendors and amenity teams know launch dates that drive resident behavior.
Event-based demand works when you connect those signals into a shared view and convert them into operational impact. You do not need perfect precision—being directionally right with a lead time is what lets you adjust staffing, storage, and carrier instructions before the backlog forms.
A practical test: if a change would make you say, “We should warn the front desk” or “We should tell carriers where to go,” it is probably an event you should capture for forecasting.
Common failure mode: reacting after the package room is already jammed
The typical breakdown is not a lack of effort; it is timing. The mailroom looks fine on Monday. By Wednesday, shelves are full, the front desk is stacking overflow behind the counter, QR labels are getting missed, and accountability slips because the team is trying to keep the line moving. By Friday, carriers are hunting for space, residents cannot find items quickly, and staff time shifts from “receive correctly” to “sort the mess.”
This is exactly what event-driven forecasting prevents. When you plan by events, you can pre-decide the surge playbooks: when to add a runner, when to open overflow staging, when to simplify handoff steps, and when to adjust carrier placement instructions. The goal is not to be perfect—it is to avoid the predictable crunch that happens when volume and constraints spike at the same time.
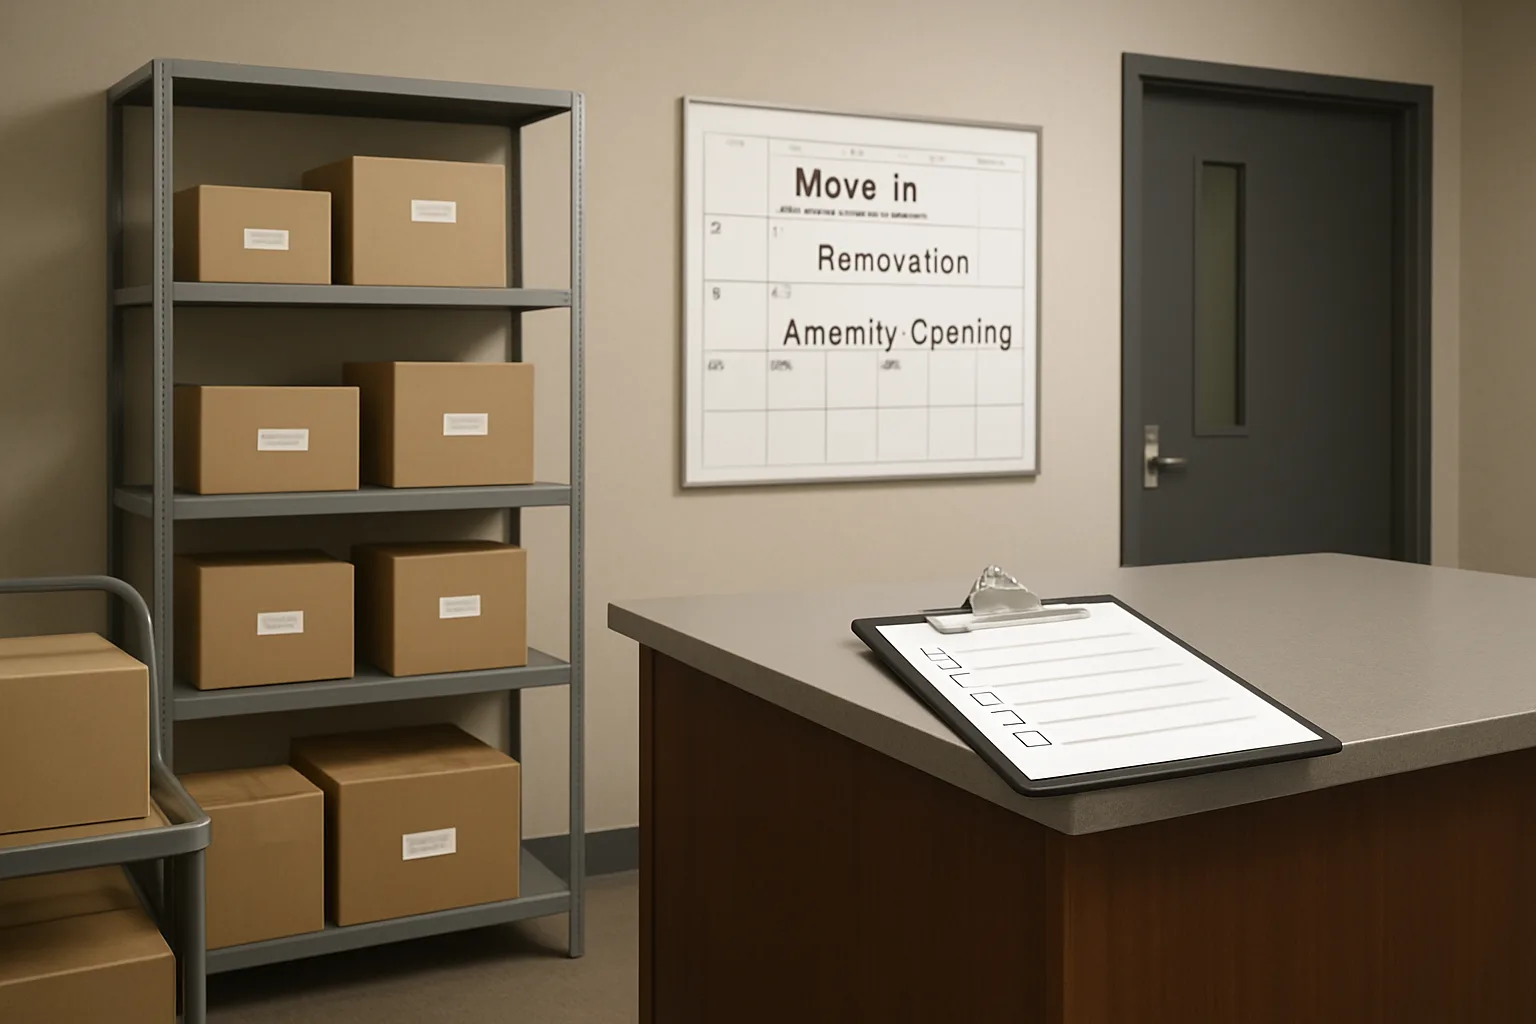
Build the Event Inventory: A Simple Calendar That Ops and Leasing Can Maintain
Package volume forecasting for apartments gets easier when everyone is working off the same event picture. The goal is not a perfect prediction model; it is a dependable, portfolio-ready habit: capture a short list of property events early, in a consistent format, so onsite teams can translate them into expected package deltas and prep staffing, space, and carrier instructions before the surge hits.
This is the simplest structure that works across multiple buildings: one shared 'Property Events' log per property (or a portfolio view with property filters), updated weekly, with clear owners and lead times. Keep it boring and repeatable. When the log is easy to maintain, it stays current—and your mailroom staffing forecast stops being a last-minute scramble.
- A good events calendar is operational, not aspirational: it records what will actually change deliveries, access, or pickup behavior.
- Standardize the fields so a regional manager can compare properties without translating each site’s notes.
- Assign owners for each event type (leasing, construction, amenities, security/front desk) so updates do not depend on one person remembering.
- Use lead times (2 weeks, 72 hours, day-of) to trigger specific prep tasks instead of vague awareness.
Create a shared 'Property Events' log with owners and lead times
Start with one shared log that both leasing and operations can edit (or submit updates into). If you already have a construction schedule, turn calendar, or resident events calendar, do not replace it—link it. The point is to consolidate the handful of items that change package volume and flow into one operational view.
Make ownership explicit. Most forecasting breaks because the events are known, but not captured where ops can use them. A simple ownership map prevents gaps: leasing owns lease-start counts and move-in dates; construction owns unit turns and delivery-heavy phases; amenities owns launches and temporary closures; front desk/security owns access changes (door schedules, elevator downtime, loading dock restrictions).
Add lead-time expectations to each event entry. Your future self needs to know when the event becomes “real enough” to act on. A practical default is: draft entry when it appears (often 2–4 weeks out), confirm details 72 hours out, and a day-of check for access constraints and signage/carrier notes.
Minimum fields: what to capture so the forecast is consistent
If you only capture one thing, capture dates. If you capture three things, capture dates, size, and constraints. Below is a minimum set of fields that stays lightweight but is specific enough to convert into daily package deltas and shelf-capacity needs later.
Keep the fields structured (dropdowns where possible). Free-text notes are useful, but they cannot be compared across properties or quickly filtered when you are trying to plan peak volume planning across a region.
Minimum fields (copy into your worksheet or shared log)
Use these as columns. They are intentionally plain-language so onsite teams will actually fill them out:
Event log fields (minimum viable)
Event name and type (standard list)
Property/building/entry point affected (e.g., Building B lobby, package room, loading dock)
Start date/time and end date/time (include time windows, not just dates)
Scope fields
Affected units or residents (count or unit list)
Expected delivery drivers (who is impacted: carriers, furniture couriers, contractors, food delivery)
Resident behavior impact (higher receiving, lower pickup, both)
Constraints fields
Access constraints (elevator down, door locked after 6 pm, construction path changes, loading dock closed)
Package-room constraints (room closed, shelves removed, staging area reduced)
Carrier impact (alternate entrance, delivery window change, temporary reroute, placement rules)
Operations fields
Onsite owner (person/role)
Confirm-by date (72-hour check)
Notes (only what would change a plan: signage needed, QR-label process changes, temporary handoff checklist, etc.)
Event categories that matter most for volume and flow
For package volume forecasting for apartments, not all events are equal. Some increase arrivals (more packages coming in). Others increase dwell time (packages stay longer because pickup gets harder). Your event calendar should flag both, because shelf capacity fails just as often from slowed pickups as from higher deliveries.
Use a short, standardized list of event categories so teams do not invent new labels every week. The categories below are the ones most likely to create either sudden volume spikes or bottlenecks in scanning, staging, or resident pickup.
High-impact event categories to standardize
Move-in and move-out volume changes
Lease starts by day (especially clustered move-in dates)
Bulk unit turns (multiple units in a short window)
Renovation and construction delivery spikes
Flooring/cabinet/appliance delivery weeks (large, bulky items that occupy staging space)
Waste/removal days that reduce usable hallway or package-room space
Vendor stacking restrictions (when materials cannot be left unattended or must be signed for)
Access, routing, and downtime events (flow disruptions)
Elevator downtime or restricted elevator hours (slows runner trips, slows resident pickup)
Loading dock closure or limited dock hours (creates delivery bunching)
Lobby/front desk staffing reductions, holidays, or training days (scan/receive throughput drops)
Package room and storage constraints
Package-room closure, renovation, shelf removal, or repainting (reduces capacity)
Temporary overflow space availability (conference room, vacant unit staging)
Resident demand drivers (not seasonality, but local events)
Amenity launches or reopens (resident engagement spikes; delivery patterns shift)
Community events that change building traffic (pickup windows compress into fewer hours)
Policy changes (new carrier instructions, new package acceptance rules, new pickup process)
Lead-time checklist: what you need 2 weeks out, 72 hours out, day-of
Treat lead time as a workflow, not a reminder. Each time horizon should answer: what decision can we make now that prevents backlog later? Your events log becomes most valuable when it triggers consistent actions: reserve overflow space, adjust staffing blocks, set carrier instructions, and prep the receiving process (signage, QR labels, handoff checklist).
Below is a practical checklist that aligns leasing, ops, and vendors without requiring a dedicated analyst or a complex system.
Two weeks out (or as soon as it appears on the radar)
Objective: lock the what and when, so you have time to reserve capacity. Focus on scope and constraints, not perfect detail.
2-week items to capture or confirm
Move-ins: lease-start count by day (even if tentative), and any large group move-ins (corporate leases, roommate clusters)
Construction: upcoming delivery-heavy phases (flooring, appliances), and where items will be staged
Known constraints: planned elevator downtime, dock limitations, door schedule changes, package-room work orders
2-week operational prep triggers
Flag potential overflow spaces and get pre-approval to use them if needed
Draft carrier notes (alternate entrance, delivery windows, where to place oversize)
Put a placeholder on the onsite schedule for surge coverage (even if you adjust later)
72 hours out (confirmation checkpoint)
Objective: convert the event from “likely” to “planned.” Tighten dates, counts, and access details. This is where your mailroom staffing forecast starts becoming specific.
72-hour items to confirm
Exact start/end dates and daily time windows (especially for elevator/dock access)
Updated move-in list and expected key pickup times (if leasing has scheduled appointments)
Any vendor delivery appointments requiring signatures or controlled access
72-hour operational prep triggers
Confirm who is receiving and scanning during the peak window (front desk vs. runner vs. manager)
Pre-stage supplies (labels, carts, designated oversize spots) and refresh the handoff checklist
Finalize temporary carrier instructions and resident-facing pickup guidance (hours, entrance, where to go)
Day-of (execution and adjustments)
Objective: avoid surprises that create dwell time. Confirm access, keep the receiving flow moving, and document what changed.
Day-of checks
Access reality check: elevator status, doors unlocked as planned, staging area still available
Staffing coverage check: who is on point for receiving, scanning, and shelf organization
Carrier handoff check: are drivers using the correct entrance and placement rules
Day-of operational actions
Post simple, immediate guidance at the relevant point (lobby desk, package room door) so residents and drivers do not improvise
If constraints changed (e.g., elevator down unexpectedly), update the event entry and notify the team so capacity assumptions adjust in real time
Capture a quick note at end of day: what slowed receiving or pickup (this becomes calibration input later)
The No-Data-Science Worksheet: Convert Each Event Into Daily Package Deltas
Package volume forecasting for apartments does not have to start with a data warehouse. You can get 80 percent of the operational value with a simple worksheet that turns known property events into expected daily package deltas, then rolls those deltas into a mailroom staffing forecast and peak volume planning for shelf capacity.
The goal is not to predict the exact number of boxes. The goal is to see surge days early enough to change staffing, staging space, and carrier instructions before the backlog forms. This worksheet is designed for onsite teams and regional managers to maintain in minutes, using inputs you already have (leasing reports, turn schedules, elevator notices, amenity launch plans).
- Use a baseline daily volume, then add event-driven incremental packages per day (deltas).
- Model surges with a simple ramp/peak/decay curve instead of a single flat number.
- Keep assumptions explicit and editable so you can calibrate them over time without “data science.”
- Plan a range (low to high) with a confidence dial, not a single-point forecast.
Worksheet inputs: baseline daily volume, event size, ramp/decay curve, and confidence level
Set up one worksheet tab per property and one row per event. The worksheet works best when it is boring and consistent: everyone uses the same fields, and you can scan next two weeks of events at a glance.
Start with a baseline. This is your “normal” package arrivals per day for the property (or for each day of week if you want one extra step). You can estimate baseline from a quick manual count for a few typical days, a carrier log, or your package room intake log. Precision is not required; consistency is.
Then define each event in terms of “size” (how many residents/units/shipments it affects) and “shape” (how it ramps up and decays). Finally, set a confidence level so you can produce a low and high estimate for planning. This is the key to event-based demand: you can plan actions even when the forecast is a range.
Core formula: event-driven incremental packages per day (delta)
Each event contributes incremental arrivals on top of baseline. Keep the math simple so it is maintainable in the field.
Recommended columns (one row per event):
1) Event type (move-ins, bulk turns, renovation delivery spikes, amenity opens, access disruptions) 2) Start date and end date 3) Event size (units or residents affected, or number of deliveries if known) 4) Event intensity (extra packages per affected unit per day, or extra deliveries per day) 5) Curve (ramp/peak/decay percentages across days) 6) Confidence (Low / Medium / High) 7) Notes (carrier constraints, staging location, elevator status, package room closure hours).","Core calculation (per day):","Daily event delta (packages) = Event size x Event intensity x Curve factor for that day","Daily forecast (packages) = Baseline daily packages + Sum of all event deltas for that day","If you want a low/high range for your mailroom staffing forecast, add a confidence multiplier:","Low delta = Daily event delta x Low multiplier; High delta = Daily event delta x High multiplier","Example confidence multipliers you can adopt portfolio-wide (adjust later): Low = 0.7, Medium = 1.0, High = 1.3. The exact numbers are less important than using them consistently so teams plan peak volume planning with a buffer when uncertainty is high.
Suggested default assumptions by event type (move-ins, bulk turns, renovations, amenity opens, access disruptions)
You need starting assumptions to make the worksheet usable on day one. Treat the following as defaults to begin with, not universal truths. The right values will vary by resident profile, carrier behavior, and how strict your package room policies are.
A practical way to define event intensity is “extra packages per affected unit per day” for resident-driven events, and “extra deliveries per day” for contractor-driven events. Pick the one that matches what you can reliably count from schedules.
Default intensity + curve ideas you can plug in immediately
Move-ins (move-in forecasting):
– Event size: number of lease starts over the move-in window (or number of keys issued if that is what you have).
– Event intensity (starting point): 0.5 to 1.5 extra packages per move-in per day during the first week. (Use the low end if residents pick up quickly and you have strict notification/pickup rules; use the high end if pickup friction is common.)","Suggested curve for a 7-day move-in impact:",- Day 1: 20% Day 2: 40% Day 3: 70% Days 4-5: 100% Day 6: 60% Day 7: 30%","Bulk unit turns (multiple units turning at once):","- Event size: number of units turning in the same window.",- Event intensity (starting point): 0.2 to 0.8 extra packages per turned unit per day, mostly from small supplies and resident overlap (if residents are moving out and in).","Suggested curve (often shorter and more operational):","- Day -1 to Day 2: 50% (prep and early deliveries)",- Days 3-4: 100% (peak)",- Day 5: 50% (tail)","Renovation delivery spikes (flooring, appliances, cabinets):","- Event size: number of delivery days or number of units receiving materials (whichever you can confidently schedule).","- Event intensity (starting point): 5 to 25 extra deliveries per day for the property, depending on how centralized the drop is and whether the carrier counts each pallet/box as a separate intake action. If you cannot estimate “deliveries,” estimate “intake actions” (times staff must receive/scan/move items).","Suggested curve:",- Delivery day(s): 100% on delivery day, 30% next day (stragglers/missed placement), near-zero after if materials go straight to staging and are not stored in the package room.","Amenity opens (new gym, co-working, pool reopening, resident events):","- Event size: number of units invited or expected to use the amenity; or simply tag as a “community engagement event.”","- Event intensity (starting point): 0.05 to 0.2 extra packages per unit per day for 3 to 7 days, driven by residents ordering gear, supplies, or event-related items. If there is swag, vendor shipments, or setup materials, model those as a separate “property shipment” line item.","Suggested curve:",- 2 days before: 30% Day before: 60% Day of: 100% Next day: 50% Then 20% for a few days.","Access disruptions (elevator downtime, package-room closures, construction blocking corridors):","This category is different: it often does not increase arrivals, but it increases “on-hand” inventory because pickups slow down and intake takes longer. In the worksheet, represent this as either:",- A negative pickup rate adjustment (used later in shelf-capacity planning), and/or
– A “handling overhead” note that triggers extra labor blocks even if package counts are flat.
If you still want a package-count delta for planning, use a small bump to represent re-attempts and misplacements (for example, 5% to 15% of baseline as extra “touches”), but track it separately so you do not confuse touches with packages.
How to handle overlapping events and avoid double-counting
In real buildings, events stack: move-ins overlap with turns; renovations overlap with elevator downtime; an amenity opening overlaps with a weekend. The worksheet stays reliable if you apply two rules: separate drivers, and cap what should not compound.
Rule 1: Separate resident-driven demand from contractor-driven shipments. For example, if a unit turn includes both a new resident and a flooring delivery, keep them as two rows. This prevents one big “turn event” from hiding what is actually driving intake volume and labor.
Rule 2: Avoid compounding the same driver twice. A common double-count is counting a move-in spike and also adding a “lease start welcome kit shipment” spike for the same residents. If your leasing process always triggers a shipment, fold it into the move-in intensity or track it explicitly but reduce the move-in intensity accordingly. The worksheet should reflect your process, not generic categories.
A simple overlap method: event priority and caps
When two events would realistically compete for the same limited behavior, use a cap:
– Example: Move-ins + amenity open both increase resident ordering. Rather than adding them fully, you might cap “resident-driven deltas” at a reasonable ceiling per unit per day for that week.
– Example: Elevator downtime does not create more packages, but it increases dwell time. Do not add it to arrivals; instead, mark it to adjust pickup friction and staffing in the next step.
Operationally, a portfolio-friendly approach is to add two columns:
– Driver type: Resident demand, Property shipments, Access/pickup friction
– Cap group: Resident-demand cap (Yes/No)
Then sum deltas by driver type. If resident-demand cap is “Yes,” apply the cap after summing resident-demand deltas for the day.
Add a confidence dial so teams can plan ranges, not a single number
A single forecast number invites false precision and late action. A range forces earlier decisions: “If we hit the high case, do we have overflow space and coverage?” That is exactly what you need for peak volume planning.
In the worksheet, assign each event a confidence rating and let that automatically widen or narrow the range. For example:
– High confidence: lease starts already executed, delivery appointment confirmed, elevator shutdown notice issued
– Medium confidence: scheduled but could slip (vendor tentative, permits pending)
– Low confidence: possible surge (marketing campaign launching, waitlist conversions expected)
Implementation in the worksheet is straightforward:
– Keep your baseline as a single number (or add a baseline low/high if your property is volatile).
– For each event delta, calculate Low, Expected, High using the multiplier tied to the confidence rating.
– Sum Low/Expected/High across events and add baseline.
This creates a daily band you can use immediately for a mailroom staffing forecast: schedule to Expected, pre-approve a “surge add-on” shift for High, and set carrier/overflow rules based on High so you are protected even if the day runs hot.

From Forecast to Operations: Mailroom Staffing Forecast and Shelf-Capacity Planning
Event-based demand is only useful if it changes what you do before the surge hits. Once you have a daily package forecast (baseline plus event-driven deltas), the next step is translating it into (1) labor blocks by role and shift and (2) shelf and overflow capacity that can absorb the peak without creating an unscannable pileup.
This section gives a practical way to turn your package volume forecasting for apartments into a mailroom staffing forecast, space planning, and carrier instructions that prevent backlogs instead of reacting to them.
- Inputs you need from your worksheet (no new data science required): baseline daily arrivals, forecasted event-driven delta by day, expected pickup rate by day, and any access constraints (hours, elevator, closures).
- Outputs you will produce: staffing blocks (by role), required shelf capacity (peak packages on hand), overflow plan (where and how), and carrier instructions (when and where to deliver).
Translate daily packages into work minutes and staffing blocks (front desk, runners, package room)
Start by converting forecasted arrivals into minutes of handling work. You do not need perfect time studies; you need consistent assumptions you can refine. Break the workflow into chunks that match how your building actually runs: carrier intake, labeling/sorting, placing on shelves, resident pickup handoff, and exceptions (oversize, unclear unit, locker issues).
A simple operational approach is to assign a “minutes per package” assumption for each role, then plan staffing in blocks (for example, 2-hour or 4-hour blocks) around carrier arrival windows and resident pickup peaks.
Practical method: 1) forecast arrivals by day, 2) estimate processing minutes, 3) map those minutes onto your staffing schedule by time of day (not just total hours). This avoids the common failure where you staff “more on Tuesday” but all carriers show up between 11:00 and 2:00 and the room jams anyway.
Shelf-capacity math: packages on hand = arrivals minus pickups, adjusted for pickup friction
Shelf capacity is about “packages on hand,” not “packages delivered.” Your peak space need happens when arrivals temporarily exceed pickups—often during move-ins, renovations, or access disruptions. Use a running balance calculation that you can do in a worksheet.
Core relationship (by day): Packages on hand end of day = Packages on hand start of day + Arrivals − Pickups.
To estimate pickups, apply a pickup rate to your on-hand inventory plus new arrivals. Then adjust for pickup friction: anything that slows pickup increases on-hand packages and therefore shelf requirements. Common friction drivers include limited pickup hours, long front-desk lines, residents waiting for elevator access, package-room closure periods, or confusing temporary rules during construction.
Design for constraints: elevator downtime, package-room closures, reduced access windows
Event-based demand planning is not only about higher arrivals. Constraints can create “artificial peaks” by reducing throughput. A normal arrival day becomes a backlog day if your team cannot move packages from the loading area to shelves or cannot release pickups efficiently.
Treat constraints as multipliers on time and as reducers of pickup rates. For example: elevator downtime increases handling time (more trips, slower movement, more staging). Package-room closures reduce pickup opportunities (lower pickup rate) and often force alternate handoff steps (more front-desk time). Reduced access windows for carriers compress intake into fewer hours, increasing the need for a staffed receiving window and a clear staging area.
Operational rule: if a constraint reduces your processing capacity for a day, plan as though your “effective volume” is higher—even if forecasted arrivals are unchanged. That is how you keep peak volume planning tied to reality, not just counts.
Peak volume planning playbook: overflow staging, QR labels, scan accountability, handoff checklists
When the forecasted peak exceeds normal shelf capacity or normal labor capacity, decide in advance exactly how you will protect flow. The goal is to keep packages (a) scannable, (b) findable, and (c) accounted for—especially when you temporarily stage overflow outside the usual package room.
A practical peak-day playbook typically includes: where overflow goes, how it gets labeled, what gets scanned when, who owns the handoff, and what happens with exceptions. The difference between controlled overflow and a pile is the process, not the space.
If you already use QR-label workflows or scanning at intake and pickup, surges are the time to tighten accountability: one intake point, one scan standard, and a short checklist for whoever is staffing the station so nothing “goes missing” in the rush.
Carrier coordination: delivery windows, placement instructions, temporary reroutes
Carrier coordination is often the fastest lever for preventing jams because it changes when and where volume hits your staff and your shelves. Use your forecast to reach out before the surge days and set clear, temporary rules that match your constraints.
The minimum operational instructions to confirm are: delivery window (or staggered windows by carrier), designated drop zone, what to do with oversize items, what to do if access is blocked (call box, loading dock closed, elevator out), and whether any temporary reroute is required during closures.
If you anticipate reduced staffing coverage at the front desk or a temporary package-room closure, do not wait until drivers arrive to negotiate. Put temporary placement instructions in writing (even if it is just a short message) and align onsite staff so the instruction is consistent every time. Consistency reduces re-delivery attempts, hallway drops, and untracked overflow.

Requested CTA
Forecasting gets easier when you treat your building like a schedule of events, not a calendar month.
When package volume planning works, it usually works because someone translated “what’s about to happen in the building” into “what will hit the package room each day.” Seasonality can tell you the baseline. An event-driven model tells you the spikes and the bottlenecks: lease starts that add arrivals for a week, bulk turns that trigger concentrated delivery days, amenity launches that change ordering behavior, and disruptions (elevator downtime, closures, limited access windows) that slow pickups and inflate on-hand inventory.
The repeatable workflow is lightweight: maintain an events calendar with clear owners and lead times, convert each event into a daily package delta using a simple worksheet (with a confidence range), and then sanity-check the forecast against constraints like shelf capacity, labor coverage, and carrier delivery windows. Most importantly, attach pre-defined playbooks to thresholds so you act before peak volume planning becomes emergency cleanup: add coverage, open overflow staging, tighten QR-label and scan accountability, and send temporary carrier placement and timing instructions.
Run a quick weekly review, capture what actually happened, and tune your assumptions over time. You do not need a full analytics program to get 80 percent of the benefit—you need an operational habit that turns known events into an actionable mailroom staffing forecast and a space plan before the surge day arrives.